How to Read a Piano Analytics Hit: A Beginner's Guide
- Published
- 10 min read
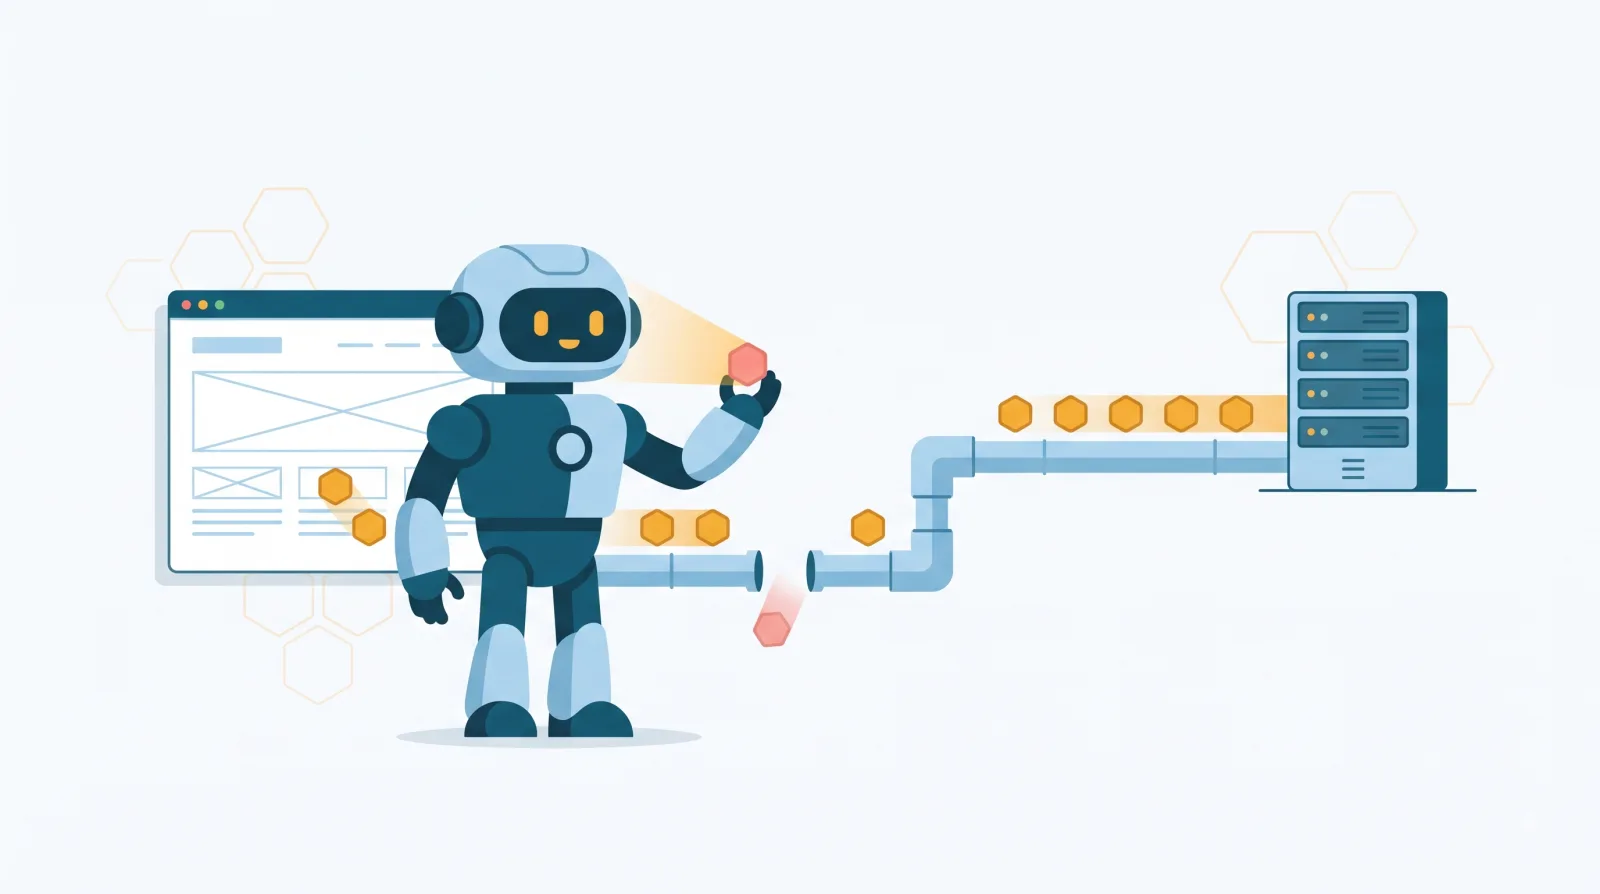
In short: a Piano Analytics hit is the request your site sends to the collection server, carrying the event name and its properties. To read one, install the Tag Inspector extension, open your browser's developer tools, switch to the Tag Inspector tab, and browse. Every hit appears with its full detail.
Someone hands you a Piano Analytics account. Someone asks you to "check the tracking is fine". And nobody has ever shown you where to look. Often the account came with an acquisition, or from a European entity, and half the team still calls the product AT Internet. I have watched a lot of junior analysts land in exactly this spot, and the blocker is almost never the analysis. It is this first move: opening the hood and understanding what you are looking at. Let's fix that, and we'll take a real hit apart line by line.
What is a Piano Analytics hit, exactly?
Every time a visitor does something on your site, the Piano tag sends a request to a server. That request is the hit. It carries two things: the name of what happened, and the context.
The name is the event, declared through pa.sendEvent(). Piano ships a standard library of them, named with dot notation: page.display for a page view, click.navigation for a click, transaction.confirmation for a purchase, av.play for video playback.
The context is the properties. Concretely:
pa.sendEvent("page.display", {
  page: "product_detail",
  page_chapter1: "catalogue",
  page_chapter2: "shoes"
});
Translation: someone viewed a page, it's called product_detail, it's filed under the catalogue section, shoes sub-section. That's it. A hit is that, nothing more mysterious.
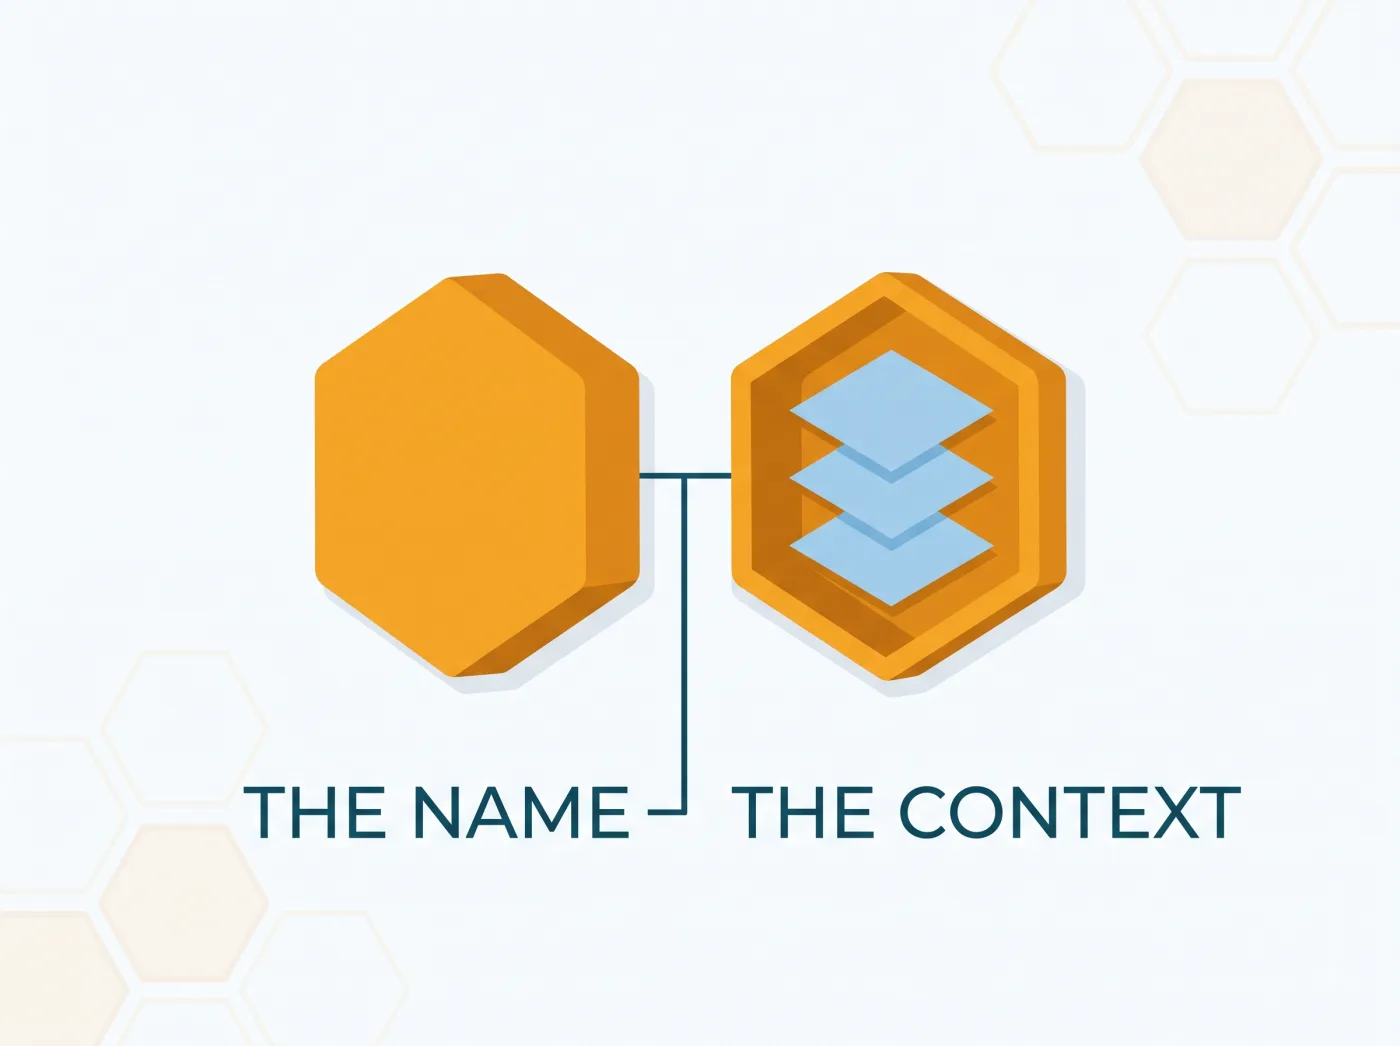
Worth internalising right now: if the event name is right but the properties are empty or wrong, your reports will be unusable. The hit will still have "fired correctly". Which is exactly why you need to read it in detail.
What vocabulary do you need to find your way around?
Six words are enough to hold a conversation with a developer about this.
| Term | What it is | Where you see it |
|---|---|---|
| Event | What happened | The hit name (page.display) |
| Property | The context around the event | The hit detail (page, page_chapter1) |
| Chapters | The filing hierarchy for your pages | page_chapter1 to page_chapter3 |
| Site ID | The collection scope | The s parameter in the request |
| Collection domain | The address the hit goes to | Ends in .pa-cd.com, or a domain of your own |
idclient | The visitor identifier | A parameter in the request |
Two useful notes. Piano provides more than 450 standard properties, so before you invent one, check whether it already exists. Otherwise you won't find it where you expect.
And chapters deserve your attention. They are what categorises your pages for reporting. If chapters are inconsistent from one template to the next, your reports will be too. It's the most common mistake, and the most painful to unwind.
What does a real Piano Analytics hit look like?
Theory is fine. Here is a real hit, captured on a production site and anonymised, exactly as you'll see it in the Events tab of Tag Inspector.
{
  "events": [
    {
      "name": "page.display",
      "data": {
        "page": "/customer-services/",
        "page_error": "",
        "page_title_html": "Customer Services - Example Corp",
        "content_title": "Customer Services - Example Corp",
        "content_type": "article",
        "content_update_date": "2026-03-03T10:46:37.000Z",
        "has_access": "anon",
        "event_url_full": "https://www.example-corp.com/customer-services/",
        "previous_url": "https://www.example-corp.com/",
        "pageview_id": "a1b2c3d4e5f6g7h8",
        "visitor_privacy_consent": false,
        "visitor_privacy_mode": "exempt",
        "event_collection_platform": "js",
        "event_collection_version": "6.18.0",
        "browser_language": "en",
        "ch_ua_platform": "macOS",
        "ch_ua_mobile": false,
        "device_screen_width": 1440,
        "device_screen_height": 900,
        "device_display_width": 676,
        "device_display_height": 687,
        "cookie_creation_date": "2026-06-12T09:14:00.000Z"
      }
    }
  ]
}
First reflex: sort. These properties do not all have the same status, and confusing what your implementation decided to send with what the SDK adds by itself is the number one source of confusion for beginners.
| What you're reading | Who sends it | What you do with it |
|---|---|---|
name, page | Your implementation | Check against the tagging plan |
content_*, has_access | Your implementation, or a Piano content integration | Confirm with the technical team |
ch_ua_*, device_*, browser_* | The SDK, automatically | Leave alone |
previous_url, pageview_id, event_url_full | The SDK, automatically | Useful to reconstruct a journey |
visitor_privacy_* | The privacy configuration | Check first |
event_collection_* | The SDK | Your version, worth knowing |
Now, five things to spot in this particular hit.
There are no chapters at all. No page_chapter1, and the page name is the URL path. This site has no filing hierarchy in Piano: the reporting will list raw URLs with no grouping level available. You cannot cleanly answer "how many views across the whole Customer Services section" without hacking together string filters. That isn't a bug, it's an implementation choice. One I'd advise against, but a choice. If you see this on your account, the question to ask isn't "why is it missing" but "did anyone ever decide on a chapter structure, or did we tag as we went?".
Privacy mode is exempt. Combined with visitor_privacy_consent: false, that means the visitor did not consent and collection runs anyway, in exempt mode, with restricted data. It's a common European setup for staying measurable without a blocking banner. If you're QA-ing this site, you must replay the journey in consented mode to see what changes. It is not the same data.
The SDK version is right there: 6.18.0. Write it down. Behaviour differs meaningfully between versions, and it's the first question support will ask you.
previous_url tells you the journey. Here the visitor came from the homepage. It's your breadcrumb for reconstructing navigation without taking notes by hand.
And the sneakiest trap of all. Look at device_screen_width: 1440 against device_display_width: 676. The screen is 1440 pixels wide, but the visible viewport is only 676. Why? Because the developer tools were open and docked to the side, halving the visible window. Which means your own QA sessions distort your resolution data. Dock your tools to the bottom, or pop them out into a separate window.
That last point holds for all your QA work, on Piano and everywhere else. You are measuring the site, but you are also measuring the way you look at it.
How do you install and open Tag Inspector?
Tag Inspector is the free browser extension Piano provides to check a site's tagging manually. It lays out every parameter your tagging generates. It's your main tool, and it takes three steps.
- Install the extension from the Chrome Web Store.
- Open developer tools (F12, or Ctrl/⌘ + Shift + I), then switch to the Tag Inspector tab. A popped-out or bottom-docked layout is recommended, you'll see far more. And, as we just saw, it stops you distorting your own resolution data.
- Browse your site. Hits fill in as you go.
What you're looking at is a hit table listing, per row, the hit position, the URL that generated it, the hit type, the event label (page name, click name), the site ID, and an orange flag at the start of the row when the extension detects a problem.
That orange flag is your best friend as a beginner. It surfaces problems you wouldn't have known to look for.
Now click a row. The right panel gives you the hit detail, an Events tab with the event name and every collected property along with its type (exactly what you took apart above), and a Cookies tab listing the Piano cookies dropped.
One piece of advice I give every time: log into your Piano Analytics account. The extension then automatically pulls information for the sites you have access to, replaces the site number with its label, and picks up your custom domains. You go from "site 123456789" to something readable. That changes everything when you're starting out.
Two functions worth knowing once you're comfortable: exporting hits to JSON or CSV, and resetting the session to start from a clean table. Export before you close, it'll save you redoing the whole pass.
How do you read a hit without the extension, in the Network tab?
Sometimes you don't have the extension, or you want the raw request. Open developer tools, Network tab, and filter on your collection domain. By default it ends in .pa-cd.com.
You'll then see the request as it leaves, with the s parameter for the site, the idclient parameter for the visitor, and a payload listing events with their names and data. The JSON block taken apart above is precisely what you'll find in that payload.
It's less comfortable than Tag Inspector, but it's the unfiltered truth. Learn to do both: the day the extension and the browser tell you different stories, you'll know how to settle it.
What are your first three checks as a beginner?
Don't try to verify everything. Start with these three, they catch most of what's visibly broken.
One page, one page.display. Load a page, count. If there are two, you have a duplicate, and your traffic is artificially inflated. On a single page application, repeat the test on every screen change.
The right site ID. Check the site ID column in the hit table. The classic failure is staging sending its data into the production site for weeks without anyone noticing.
Properties aren't empty. Open the Events tab on three or four different page types: homepage, category, product detail. Compare against the tagging plan. An empty property, or a chapter missing or inconsistent between templates, means a distorted report.
Clear those three and you've already eliminated a good share of what actually breaks.
Why can't I see any Piano Analytics hits?
It happens to everyone on day one, and it's almost never because the tag is missing.
Your ad blocker. Cause number one, by a distance. Turn it off, or work on a clean browser profile dedicated to QA.
A custom collection domain that isn't declared. If your site collects through a domain of your own rather than .pa-cd.com, the extension doesn't know about it. You have to add it manually in the extension settings, via the gear icon top right, in the collection domains section. Without that you see nothing and wrongly conclude the tag isn't firing.
A stale filter in the Network tab. Check you haven't left a filter running from an earlier session.
Consent refused. If you declined cookies on the banner, reduced or zero collection is expected behaviour. As in the hit taken apart above, look at visitor_privacy_mode: it tells you which regime you're in.
Wrapping up
Reading a Piano Analytics hit is not expert knowledge. It's a ten-minute skill nobody ever showed you. Keep the starting trio: Tag Inspector open in developer tools, logged into your account so labels are readable, and the three basic checks (one page.display per page, the right site ID, no empty properties).
And hold on to the reflex from the payload we took apart: inside a hit, always separate what your implementation chose to send from what the SDK adds automatically. The first column is the one that concerns you.
Once that move is second nature, the next step is turning it into a method: what to check, in what order, and how to confirm the hit actually lands on the Piano side. That's what our complete Piano Analytics tracking QA method covers.
And the day repeating those checks on every release becomes impossible to sustain, that is exactly what MayIA° automates: an AI agent that replays your user journeys and re-checks every event continuously, before and after each release. Request a demo.
FAQ
Is Tag Inspector free?
Yes. Piano describes it as a free browser extension for checking a site's tagging manually. You can use it without logging in, but signing into your account enriches the display considerably.
Why is there no page_chapter1 in my Piano Analytics hit?
Because chapters are optional: nothing breaks if the implementation doesn't send them. It's common on sites that use the URL path as the page name. The consequence isn't technical, it's analytical: you lose any ability to group pages by section in your reports.
What's the difference between Tag Inspector and Stream Inspector?
Tag Inspector runs in your browser and shows what your site sends. Stream Inspector lives inside the Piano Analytics interface and shows what arrives on the server side. A beginner starts with Tag Inspector; you need both as soon as you run a proper QA pass.
Do you need to know how to code to read a Piano Analytics hit?
No. Reading an event name and a list of properties in Tag Inspector requires no development skill. Coding becomes useful for fixing a problem, not for spotting one.
What does the orange flag in the hit table mean?
It's a warning the extension raises on that specific hit row. You can turn on detailed warning descriptions in the extension settings to understand what's being flagged. Make a habit of clearing those flags before anything else.