How to QA Your Piano Analytics Tracking: The Complete Method
- Published
- 9 min read
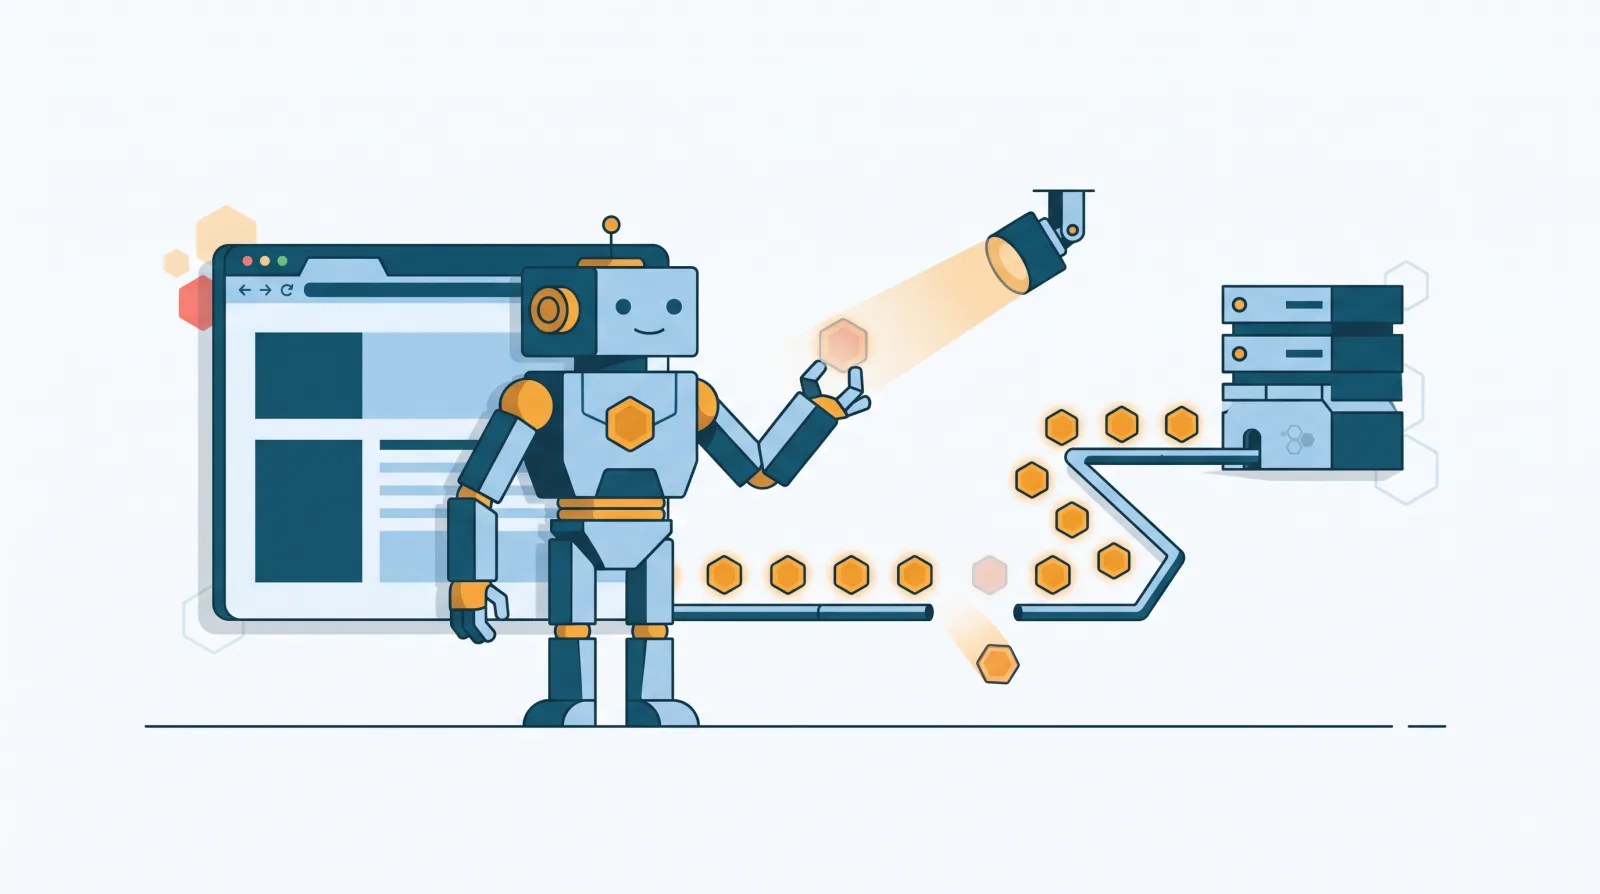
In short: QA-ing your Piano Analytics tracking means checking, before every release, that each event fires with the right name, the right properties, and reaches the right collection domain. Three tools cover it: the Tag Inspector browser extension, the Stream Inspector in the Data Collection Portal, and your browser's Network tab.
Search for "how to debug GA4 tracking" and you drown in tutorials. Search for the same thing on Piano Analytics and you get the vendor documentation, which is strong on implementation and nearly silent on validation, plus a handful of forum threads. If you inherited a Piano account, or if your team still calls it AT Internet, you are mostly on your own. So we built our own method across client projects. Here it is in full.
How is Piano Analytics QA different from GA4 QA?
The difference is structural. On a GA4 project, you validate a dataLayer first, then check how GTM turns it into an event. On Piano Analytics there is no standardised dataLayer. The SDK is called directly, and events are declared through pa.sendEvent() with a name and a set of properties. Your source of truth is not a data layer, it is your tagging plan checked against the Piano data model.
Second difference: the vocabulary. Piano Analytics runs on an event model, with standard events named using dot notation (page.display for a page view, click.navigation for a click, transaction.confirmation for a purchase, av.play for media playback) and more than 450 standard properties available. A property invented outside that reference set will fire, but it will not surface where you expect it.
Third difference, and the expensive one: the chapter hierarchy. The page_chapter1 through page_chapter3 properties structure how your pages are categorised for reporting. Which means your entire analysis tree depends on a decision taken before tagging, not after.
If you come from GA4, your "let me check the dataLayer" reflex no longer applies. If you come from Adobe or Matomo, you arrive with actions and numbered custom dimensions and you have to re-express everything as named events and chapters. Either way, QA is not a formality you bolt on at the end of the project.
Quick note on terminology: French teams call this phase recette. In English, treat it as tracking QA, and treat it as a gate before release, not a look-and-see after it.
How do you read a Piano Analytics hit in your browser?
This is the base skill, and it takes ten minutes to acquire. Open your developer tools, go to the Network tab, and filter on your collection domain. By default it looks like xxxxxxx.pa-cd.com, unless your implementation uses a custom domain.
What to look for in the request:
- The site ID: the
sparameter, which identifies the collection scope. Get this wrong and your data lands in the wrong site. It happens between staging and production more often than anyone admits. - The visitor identifier: the
idclientparameter. - The payload: a list of events, each with its name and its data block (the properties). This is what you check line by line against the tagging plan.
- The tag configuration: the script loads from
tag.aticdn.netand receives at minimum asiteand acollectDomain.
A minimal call, to make it concrete:
pa.sendEvent("page.display", {
  page: "product_detail",
  page_chapter1: "catalogue",
  page_chapter2: "shoes"
});
If you can read that, you are self-sufficient for about 80% of the QA work. The rest is discipline and tooling. And if the move isn't second nature yet, we've broken it down step by step, with a real payload taken apart line by line: learn to read a Piano Analytics hit.
Which tools should you use to QA Piano Analytics tracking?
Good news, and I say it all the more happily because the Piano ecosystem has a reputation for being closed: the tooling is better than people assume.
| Tool | What it shows | Its limit |
|---|---|---|
| Tag Inspector (Piano Chrome extension) | Every event in a session, property detail and types, cookies dropped | One session, one browser, one human watching |
| Stream Inspector (Data Collection Portal) | Hits received on the Piano side, filterable by value | Won't tell you why a hit is missing |
| Network tab | The raw request, no intermediary | Unreadable across a long funnel |
| Omnibug / Analytics Debugger | Piano alongside your media pixels | Less precise on the Piano data model |
| Data Query API | Real volumes after release | Retrospective, not preventive |
Tag Inspector is your entry point. It gives you a hit table, a detail panel per hit, and an Events tab listing the event name with every collected property and its type. You can copy a hit as JSON, and you can even test a hit by pasting its URL. If you are logged into Piano Analytics, the extension picks up your session and shows you information absent from the raw hit, such as the label behind an ID. For me that is the standout feature: the hit-testing function is badly under-used, and it settles half the "is it the tag or the config?" arguments on the spot.
Watch out for one silly trap: if your collection runs through a custom domain, you have to add that domain in the extension settings. Otherwise you see nothing and conclude, wrongly, that the tag isn't firing.
Stream Inspector is the only one that answers the real question. You'll find it inside Piano Analytics, under Configuration and then Data Collection Portal, and it lets you see incoming hits and filter on specific values. A tag that fires correctly is good. A hit that lands correctly is what counts. Those are two different checks, and the second is the one everybody skips.
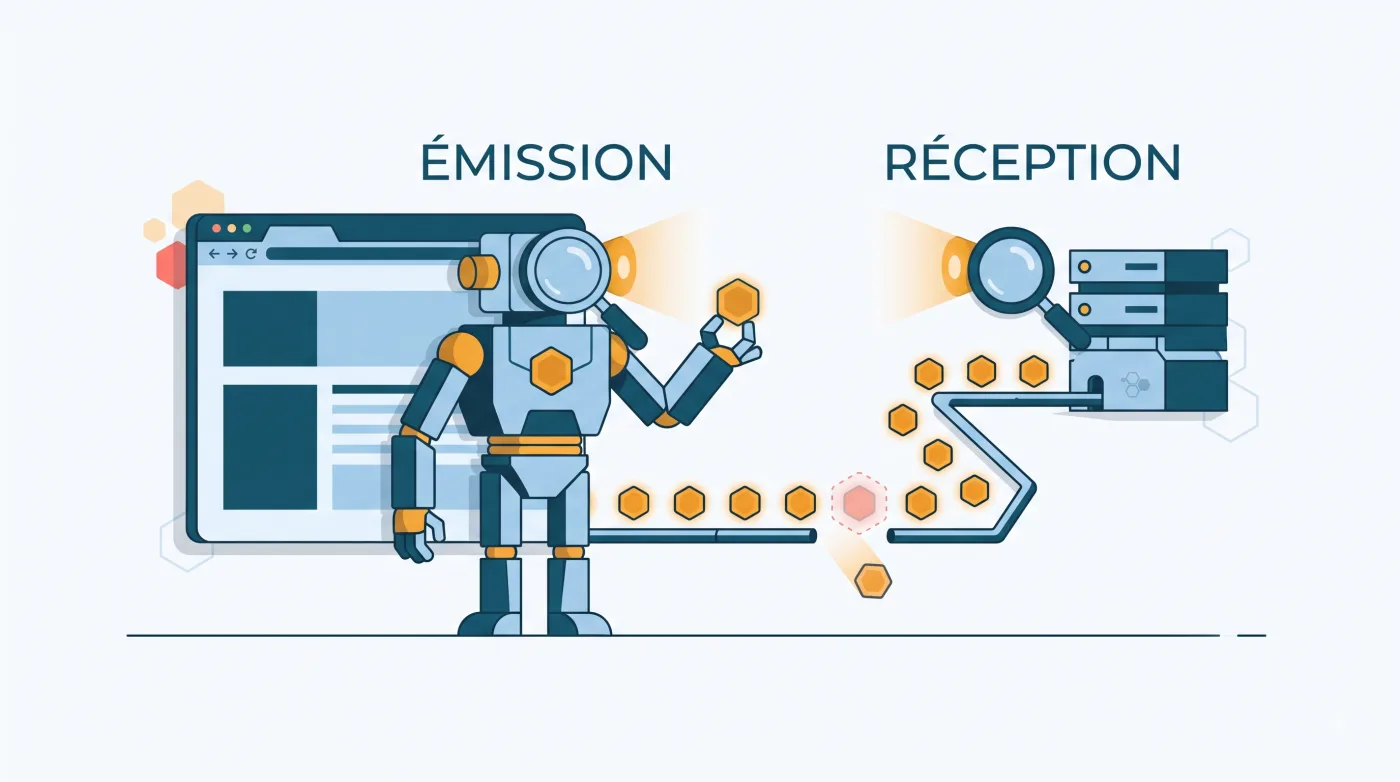
The 8 checkpoints of a Piano Analytics QA pass
This is the list we run every time, in this order.
- Per-environment configuration.
siteandcollectDomaincorrect, and above all different between staging and production. The classic failure: staging polluting the production site for three weeks. - One
page.displayper page. A single fire, carrying the expectedpageproperty. - Chapter consistency.
page_chapter1topage_chapter3populated per the plan, and populated the same way across every template. One product page that files its chapter 1 differently from another product page gives you an unusable report. - Interactions.
click.navigationevents with their click properties and page context. - The commerce funnel. Transaction events with amounts, currency and product properties. QA this on a real purchase, not a simulated one.
- Visitor identification. The user identifier sent, and consistent from page to page.
- Consent states. Replay the journey in every configuration: full consent, refusal, partial choice. Piano applies different collection rules depending on the configured consent mode and privacy mode. This point deserves a dedicated QA session on its own.
- The hit lands. Final check in Stream Inspector. The first seven points validate emission; this one validates reception.
Bear in mind that on a single page application, point 2 replays on every route change. That is your duplicate factory.
What are the most common Piano Analytics tracking mistakes?
The same ones, project after project.
Duplicate page views. Piano offers an Instant Tracking mode that fires page views automatically with no configuration. Handy to get started. Brutal if someone later adds manual calls without switching the automatic mode off: every page is counted twice, and you spend a week wondering why your traffic doubled overnight.
Properties outside the data model. A custom property invented in a corner will fire fine, but it doesn't align with the reference set and you won't find it where you expect it in reports. The documentation also distinguishes properties sent in the code, available immediately, from properties computed during processing. Knowing which category you're in saves hours of doubt.
Chapters decided after tagging. You tag, you ship, and three months later marketing wants a different tree. Full retag. That decision belongs in a workshop, with the people who will actually read the reports.
Badly purged SmartTag legacy. Piano documents a migration path from SmartTag. On older accounts there are usually properties mapped in a hurry that now coexist with the new ones. Nobody dares touch them. The report turns into a minefield.
The custom collection domain certificate. A custom collection domain comes with a certificate to renew. The day it expires, collection stops. That isn't a tracking bug, it's an operations problem, and no functional QA pass will catch it.
The tester's own browser. Leave an ad blocker running and you'll sign off an implementation on a session where half the hits never fired. Always QA on a clean profile.
Why doesn't manual tracking QA hold up over time?
Because it is perfect on release day and out of date three weeks later.
Do the maths honestly. A serious commerce funnel is easily 40 to 60 events to check. Multiply by consent states, by mobile and desktop, and you are into several hundred verifications. Half a day at best, if you know the site by heart. Nobody redoes that on every deployment. So you QA once, then you cross your fingers.
And a tracking regression doesn't announce itself. It doesn't break the site, it throws no error, it shows up in no technical monitoring. It simply makes an event disappear. You typically find out six weeks later, when someone notices a gap between the back office and the reports, or when media budget has been steered on phantom conversions.
That is exactly the problem MayIA°'s automated dataLayer monitoring goes after: an AI agent that replays your user journeys and re-checks every event continuously, before and after each release, so QA no longer depends on a human being available. Request a demo.
Wrapping up
QA-ing Piano Analytics isn't harder than QA-ing GA4, it is simply less documented. Keep three things. Your reference is the tagging plan checked against the data model, not a dataLayer. Tag Inspector plus Stream Inspector cover emission and reception, and you need both. Chapters get decided before you tag, never after.
If you take one thing away: the tag that fires is not the hit that lands.
FAQ
Does Piano Analytics have an equivalent of GA4 DebugView?
Not under that name, but the function exists. Stream Inspector, in the Data Collection Portal, shows incoming hits and lets you filter on values, which covers DebugView's main use case. On the browser side, the Tag Inspector extension plays the real-time debugger role.
Do you need a dataLayer to use Piano Analytics?
No, it isn't required: the SDK is called directly in JavaScript. We still recommend maintaining one. An intermediate data layer gives you a single control point, makes QA far easier, and saves you from reworking everything if you add another tool later.
How do you check that a Piano Analytics hit is actually received, not just sent?
By cross-referencing two views: the Tag Inspector extension on the browser side for emission, Stream Inspector on the Piano side for reception. A hit visible in the first and absent from the second points to a collection domain, site configuration or filtering problem, not a tag problem.
Can you QA Piano Analytics tracking in a mobile app?
Yes. Piano provides SDKs for Android, iOS and Flutter, plus a browserless JavaScript version and an HTTP collection API. The QA logic is the same, but inspection goes through a network proxy rather than a browser extension, which makes the reception check in Stream Inspector even more important.
How long does a full Piano Analytics QA pass take?
On a commerce site, budget half a day to a day for a serious first pass, including consent states and the mobile plus desktop double check. The hard part isn't the first pass. It's repeating it on every release.